Voting Day in Prince Edward County’s municipal election is less than one week away.
As in the 2018 municipal election, voters in Picton, Bloomfield/Hallowell, and Ameliasburgh elect more than one Councilor to office – being eligible to cast a number of votes equal to the number of elected Councilors in their Ward:
| Ward | Offices | Candidates |
| Picton | 2 | 5 |
| Bloomfield/Hallowell | 2 | 3 |
| Ameliasburgh | 3 | 5 |
Some voters may cast fewer votes than they’re eligible to cast – perhaps deciding to vote strategically for just their preferred candidate(s).
Take this year’s election in Bloomfield/Hallowell, for example. There are three candidates (we’ll call them A, B & C) running for two offices – giving voters several choices when it comes to voting. Voters may vote for two candidates (A&B, A&C, or B&C) or they may vote strategically for just one (A, B or C).
Strategic Voting in 2018
Official results of the 2018 municipal election allow us to estimate the extent of strategic voting in Picton, Bloomfield/Hallowell, and Ameliasburgh recently.
Table 2 presents the total number of actual vs total possible votes for candidates, given the number of ballots cast in these Wards.
| Ballots Cast | Actual Votes for Candidates |
Total Possible Votes |
|
| Picton | 1,552 | 2,666 | 3,104 |
| Bloomfield/Hallowell | 1,739 | 2,914 | 3,478 |
| Ameliasburgh | 1,964 | 4,933 | 5,892 |
We see that the actual votes for candidates fell significantly short of the total possible votes in these Wards.
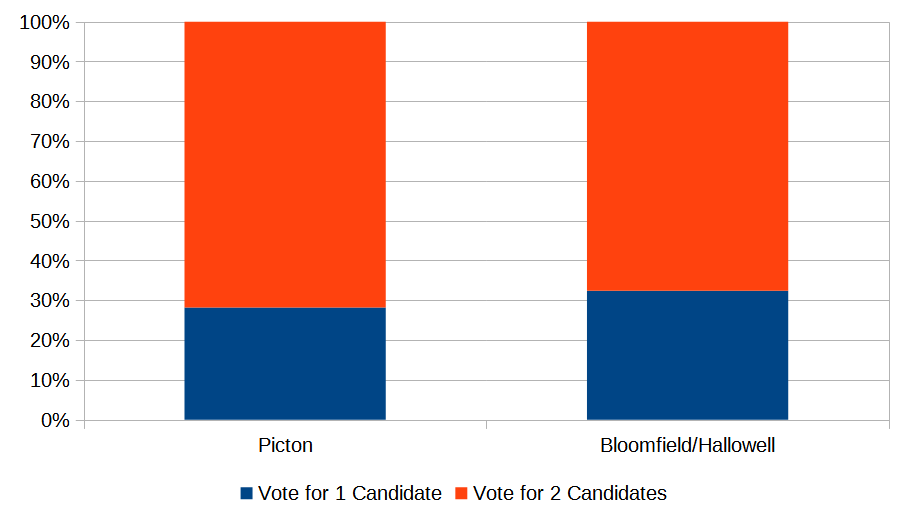
It’s pretty straightfoward to determine the number of strategic voters in Picton and Bloomfield/Hallowell from the number of ballots cast and the total number of votes for candidates: Nearly one-third of voters in these Wards voted strategically for just one candidate in the 2018 municipal election (see Table 3 & Figure 1).
| Picton | Vote for 1 Candidate |
Vote for 2 Candidates |
Total |
| Ballots cast (N) | 438 | 1,114 | 1,552 |
| Ballots cast (%) | 28.2% | 71.8% | 100.0% |
| Votes (N) | 438 | 2,228 | 2,666 |
| Votes (%) | 16.4% | 83.6% | 100.0% |
| Bloomfield/Hallowell | Vote for 1 Candidate |
Vote for 2 Candidates |
Total |
| Ballots cast (N) | 564 | 1,175 | 1,739 |
| Ballots cast (%) | 32.4% | 67.6% | 100.0% |
| Votes (N) | 564 | 2,350 | 2,914 |
| Votes (%) | 19.3% | 80.7% | 100.0% |

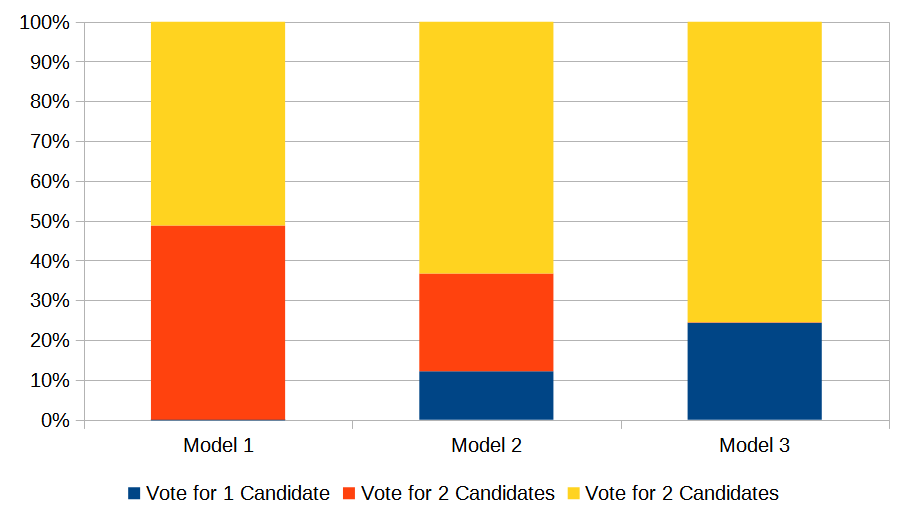
It’s a bit more complicated in Ameliasburgh; in fact, there’s many models that might account for voting there. Table 4 & Figure 2 present 3 models – two models at either the end of the solution space and one intermediate model.
Model 1 represents the smallest number of voters (n=1,005, or 51.2%) who could have voted for three candidates; Model 3 represents the largest number of voters (n=1.484, or 75.6%) who could have voted for three candidates; and Model 2 represents an intermediate situation.
These models suggest that one-quarter to one-half of voters (24.4% to 49.8%) in Ameliasburgh voted strategically for just one or two candidates in the 2018 municipal election.
| Model 1 | ||||
| Vote for 1 Candidate |
Vote for 2 Candidates |
Vote for 3 Candidates |
Total | |
| Ballots cast (n) | 0 | 959 | 1,005 | 1,964 |
| Ballots cast (%) | 0.0% | 48.8% | 51.2% | 100.0% |
| Votes (n) | 0 | 1,918 | 3,015 | 4,933 |
| Votes (%) | 0.0% | 38.9% | 61.1% | 100.0% |
| Model 2 | ||||
| Vote for 1 Candidate |
Vote for 2 Candidates |
Vote for 3 Candidates |
Total | |
| Ballots cast (n) | 239 | 481 | 1,244 | 1,964 |
| Ballots cast (%) | 12.2% | 24.5% | 63.3% | 100.0% |
| Votes (n) | 239 | 962 | 3,732 | 4,933 |
| Votes (%) | 4.8% | 19.5% | 75.7% | 100.0% |
| Model 3 | ||||
| Vote for 1 Candidate |
Vote for 2 Candidates |
Vote for 3 Candidates |
Total | |
| Ballots cast (n) | 479 | 1 | 1,484 | 1,964 |
| Ballots cast (%) | 24.4% | 0.1% | 75.6% | 100.0% |
| Votes (n) | 479 | 2 | 4,452 | 4,933 |
| Votes (%) | 9.7% | 0.0% | 90.2% | 100.0% |

Conclusion
Voters in Picton, Bloomfield/Hallowell, and Ameliasburgh are about to elect more than one Councilor in each of their respective Wards.
In the 2018 municipal election, a significant number (our modeling suggests about one-third of voters) cast fewer votes than they were entitled to cast – apparently voting strategically for just their preferred candidate(s).
The impact of strategic voting in these Wards in the 2022 municipal election depends on several factors, including how nearly similar candidates are in popularity (obviously) and overall voter turnout.
Nonetheless, voters with a strong preference for one candidate in these Wards might consider strategic voting to maximize their candidate’s chances of winning.
Leave a Reply
You must be logged in to post a comment.